Horizontal line
A horizontal line is a line whose y-value does not change; it travels from left-to-right or right-to-left and does not move up or down along the y-axis. It gets its name from the word "horizon" and is present in many physical objects. When we look at a sunrise over the horizon, the horizon is a horizontal line.
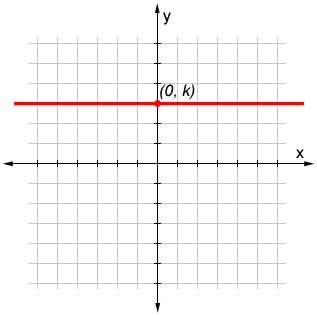
The following figure shows a horizontal line in the coordinate plane. A horizontal line in the coordinate plane is parallel to the x-axis and intersects the y-axis at some point, k.

By definition, a horizontal line never intersects the x-axis (unless the line is the x-axis itself).
Horizontal line equation
The equation of a horizontal line is:
y = k
where k is a constant that represents the y-coordinate of a given horizontal line.
Slope of a horizontal line
The slope of a horizontal line is 0. It has no slope because slope is the change in y over the change in x. Since there is no change in y, the slope equation ends up being . Given the formula for the slope-intercept form of a line, y = mx + k (more typically written as y = mx +b), we can see why the equation for a horizontal line is reduced to y = k:
y = mx + k = 0x + k
y = k
Example
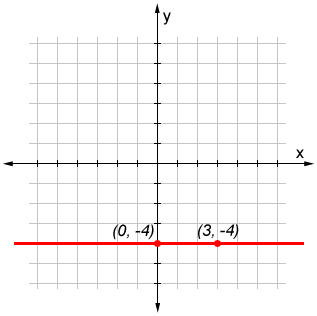
Find the equation for the horizontal line along which the points (0, -4) and (3, -4) lie.
The slope of the line is:
Then, since the y-coordinate is -4, the equation of the line is:
y = -4
How to draw a horizontal line
To draw a horizontal line in a coordinate plane, use the following steps:
- First determine the y-coordinate of the horizontal line. This may be given by a point or a few points.
- If only one point is known, select another point with the same y-coordinate and plot both points; if more points are given, plot the given points.
- Join all of the points and extend the line.
Horizontal line segment
A horizontal line and a horizontal line segment are not exactly the same. Referencing the steps above, if we only connect the points, the drawn object is a horizontal line segment. To indicate that it is a line, we simply extend the line past the end points. Adding arrows removes any ambiguity about the object being a line, but simply extending the line beyond the points, as shown in the figure below, also achieves the same effect. The figure below shows the horizontal line formed by the given points (0, -4) and (3, -4).
y = -4

Horizontal line test
The horizontal line test is used to determine whether a function is one-to-one. To use this test, draw a horizontal line across the graph. Then,
- if a horizontal line can be drawn such that it crosses the graph at more than one point, the function is not one-to-one.
- if a horizontal line cannot be drawn such that it crosses the graph at more than one point, the function is one-to-one.
An example of a function that is not one-to-one is a parabola; there are an infinite number of points at which a horizontal line would cross two points. An example of a simple one-to-one function is any line that is not a horizontal line. If the line is horizontal, a horizontal line can intersect it at all points; if the line is not horizontal, a given horizontal line can only intersect it at one point at a time.
Horizontal and vertical lines
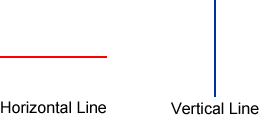
Vertical lines can be thought of as the counterpart of horizontal lines. The figure below shows a horizontal as well as a vertical line.

The table below shows some of the differences between horizontal and vertical lines.
| Horizontal line | Vertical line |
|---|---|
| parallel to x-axis | parallel to y-axis |
| 0 slope | undefined slope |
| y = k | x = k |
| y-value does not change | x-value does not change |
